DataDog
데이터독이란 무엇인가?
![]()
다양한 애플리케이션 데이터 소스를 가지고 성능과 모니터링을 할 수 있고 대쉬보드를 만들 수 있다.
성능 메트릭, 통계를 만들어서 사용할 수 있다.
데이터독은 3가지 방법으로 데이터를 수집한다
데이터독에서 제공되는 UI 메뉴
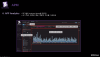
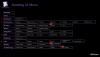 인프라스트럭처
 에이전트를 설치하게되면, 각 서버별 CPU, IO 부하, 애플리케이션 등을 확인할 수 있다.
(서버마다 설치를 하게되서 동작하는 방식인가 봄.)
host map
Live Process
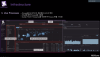
Serverless
tag는 agent에서 설정하거나 aws에서 설정한 것이 들어온다.
infrastructure 대시보드를 통해서 현재 점유율이 높은 내역들이나, 사용량대로 정렬해서 볼 수 있다.
Grouping은 tag를 최대 3가지로 나눠서 묶어서 볼 수 있다.
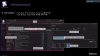
NPM
network map
 애플리케이션 간에 연동되는 통신을 모니터링 할 수 있다.
네트워크 볼륨, 트래픽 량을 상세적으로 볼 수 있다.
단, 모니터링을 하기 위해서는 통신하는 서버 별로 Agent가 설치되어 있어야 하고, 설치가 안되어 있다면 N/A로 나타난다.
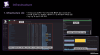
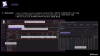
APM
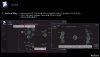 Service Performance Dashboards
 request, error, latency 등을 시각화해서 보여준다.
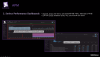
Live Search
 Connect Logs And Distributed Traces
 DataDog의 최대 장점이라고 한다.
  메서드 명, 클래스 명, 라인 번호등으로 구분해서 프로파일링을 지원해준다.
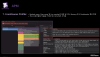
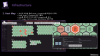
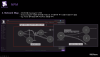
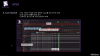
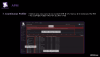
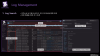
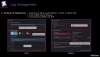
Log Management
 로그 저장 기간동안 인덱싱되서 조회가 가능하다. 현재는 15일로 되어있음
저장 기간이 지나도 커스텀 메트릭 기능으로 조회할 수 있도록 지원한다.
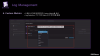
 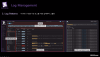 유사한 로그들을 자동으로 패턴으로 그룹핑을 해줌
클릭하게되면 실제로 그룹핑된 내역을 볼 수 있다.
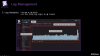   비용 효율적이란 단어가 나오는 것을 보면, 로그 처리 부분에서 많이 발생되나 봄.
인덱싱 기간이 비용과 비례해서 증가한다고 함.
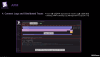
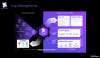
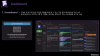
Dashboard
  위젯은 놓침..
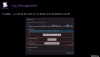
와치독을 걸어두면, 특정 시스템 장애가 발생되었을 때, 어떤 이유로 발생되었는지 확인할 수 있도록 도움을 준다.
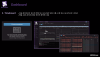
강력한 기능중에 하나는 composite 이다.
단계를 지정해서 알람 수를 최적화 할 수 있다.