github markdown에 chart (diagram) 작성방법
github markdown으로 flow chart나 diagram을 작성할 수 있는 plugin이 추가된 것 같다.
https://github.blog/2022-02-14-include-diagrams-markdown-files-mermaid/
Include diagrams in your Markdown files with Mermaid
Mermaid is a JavaScript based diagramming and charting tool that takes Markdown-inspired text definitions and creates diagrams dynamically in the browser.
github code 입력시 kotlin인지 java인지 입력하는 부분이 있었는데 여기에 지시어를 입력하고 작성하면 github 에 작성한 markdown에 diagram flowchart등이 작성되는 것같다.
https://mermaid.js.org/syntax/flowchart.html
[**Flowcharts Syntax Mermaid**](https://mermaid.js.org/syntax/flowchart.html) Flowcharts - Basic Syntax Flowcharts are composed of nodes (geometric shapes) and edges (arrows or lines). The Mermaid code defines how nodes and edges are made and accommodates different arrow types, multi-directional arrows, and any linking to and from subgraphs. WARNING If you are using the wor…
chart 종류가 꽤 다양한 것 같다.
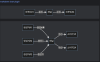
이걸 이용해서 현재 작성해본 내용은 아래와 같이 잘 나온다.
```mermaid flowchart LR ; 코루틴#1 -- 송신 --> 채널; 채널 -- 수신 --> 코루틴#2 flowchart LR
;
생성자#1 -- 송신●◆ --> 채널;
생성자#2 -- 송신○ --> 채널;
생성자#3 -- 송신◇ --> 채널;
채널 -- 수신 --> 소비자1#
채널 -- 수신 --> 소비자2#
```
markdown으로 이런 chart 등을 입력하려고 할 때, 여간 정성을 많이 들여야 되는 경우가 있었는데, 간편하게 작성할 수 있는 방법을 알게되어서 자주 써먹을 것 같다.